

As we navigate the remaining of 2024, Tiempo Capital’s mid-year market outlook provides you with essential insights into the surging equity market and the underlying risks amidst high valuations and economic uncertainties. We highlight strategic shifts to Investment Grade Fixed Income investments and examine the sustainability of consumer spending. Learn how to position your portfolio to optimize returns and manage risks in these dynamic times.
Executive Summary

Chief Investment Officer
The current mid-year market outlook is marked by high hopes tempered with significant risks. Over the past year, the S&P 500 has surged higher, driven largely by the stellar performance of a select few stocks. The market holds great expectations: for continued growth in corporate earnings, for the Federal Reserve to cut rates and further loosen financial conditions, for Artificial Intelligence to herald a new technological era, and for inflation to continue its downward trend while maintaining full employment. Indeed, these are Great Expectations, but they come with significant risks.
As we navigate through the remainder of 2024, it is crucial to recognize that these great expectations are accompanied by potential perils. Market volatility, geopolitical uncertainties, and the evolving impact of technological advancements pose significant challenges. Inflation, although moderating, remains a concern, and the trajectory of interest rates will continue to influence market dynamics.
Having reviewed numerous mid-year market outlooks from leading financial institutions in our Global Economic Forecasts report we find that their extensive analyses often boil down to three core themes: (1) a strong economy, (2) a recommendation to buy risk assets (equities), and (3) the transformative potential of Artificial Intelligence. These themes have undeniably dominated the market narrative in recent months.
In our mid-year market outlook, we aim to delve deeper into these prevailing trends, drawing comparisons to similar historical periods and projecting potential future developments. Our analysis will provide a balanced perspective, highlighting both the opportunities and the risks that lie ahead. As asset managers, our focus must remain on anticipating where the market is heading, rather than dwelling on past performance.
Our outlook is structured into three comprehensive sections:
(1) Macroeconomic Trends, (2) Equity Market Outlook, and (3) Fixed Income Market Outlook.
Highlights
Surging S&P 500 Amid High Expectations and Risks
The S&P 500’s surge, driven by key stocks and high expectations, masks significant risks including high valuations, potential recession indicators nearing the threshold, and the likelihood of aggressive Federal Reserve rate cuts in response to economic downturns.
Mixed Signals in Job Market Data
The U.S. added 1.6 million jobs, suggesting economic health. Yet, the loss of 1.551 million full-time jobs and an increase in part-time jobs, potentially inflated by seasonal adjustments, raise concerns.
Consumer Debt and Spending Sustainability in Question
While retail sales have increased, rising credit card debt and delinquencies in auto and home loans indicate financial stress among consumers, casting doubt on the sustainability of current spending patterns.
Strategic Shift to High- Fixed Income Investments Quality
Prioritize U.S. Government Securities and Investment Grade Corporate Credit over high yield. The expected Federal Reserve rate cuts support a preference for fixed-rate coupons to navigate economic uncertainties.
Macro-Economic Outlook
Strong Headline Numbers
The headline numbers for the economy have been robust, with Non-Farm Payrolls (NFP) adding a substantial number of jobs to the U.S. economy. This positive job growth, coupled with a gradual decline in inflation, has created a “goldilocks” environment for risk assets. These assets have been climbing steadily since Federal Reserve Chair Jerome Powell signaled a pause in interest rate hikes and adopted a data-dependent approach to future rate changes. Consequently, the market has priced in seven rate cuts for 2024, reigniting market optimism. Reading through various mid-year market outlooks from our investment banking counterparts, it appears the economy is performing well. However, a deeper analysis reveals potential challenges ahead.
Job Growth Analysis
Over the past year, the United States has added approximately 1.6 million jobs according to NFP, which is a key indicator of job growth. At first glance, this suggests a healthy economy with increasing employment, rising consumer income, and enhanced spending on goods and services. This is crucial because equity markets tend to underperform during recessionary periods. A recession is typically defined as two consecutive quarters of negative GDP growth or GDP contraction. GDP, or Gross Domestic Product, measures an economy’s output and is calculated using the following formula:
| GDP = C + I + G + (X – M) | |
| Where: | C = Consumer spending I = Business investments G = Government spending X = Exports M = Imports |
There are two types of GDP: Nominal and Real. Nominal GDP measures total output without adjusting for inflation, while Real GDP adjusts for inflation to reflect the true value of goods and services produced. Inflation, which erodes the purchasing power of fiat currency over time, is a key consideration when evaluating economic health. Although this may seem like a basic macroeconomic review, understanding the importance of job growth is essential. Jobs provide consumers with disposable income, which they spend on goods and services, driving economic growth
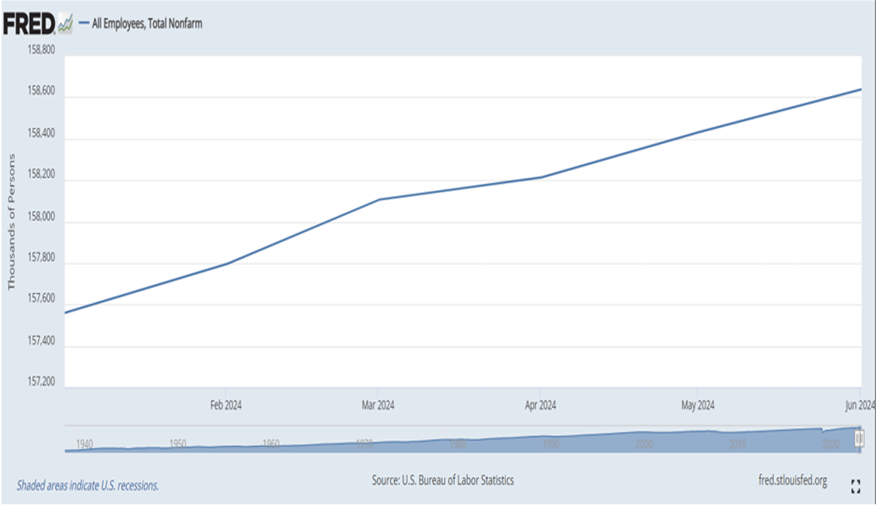
After viewing the initial chart, one might conclude that the U.S. economy is growing robustly, with Americans gainfully employed and actively spending. However, a deeper dive into the data reveals a different story. Since last June, the United States has lost 1.551 million full-time jobs.
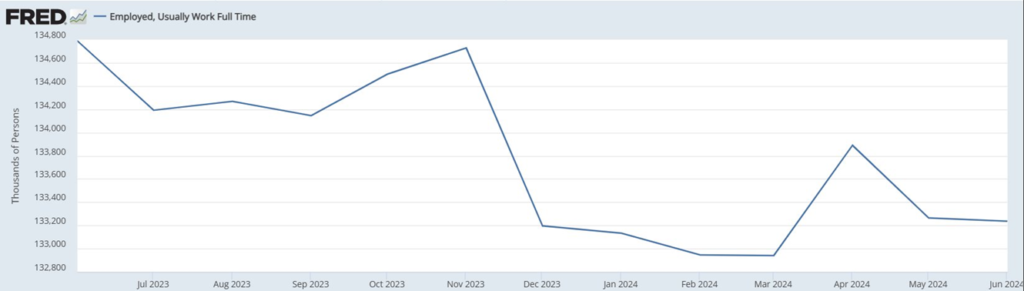
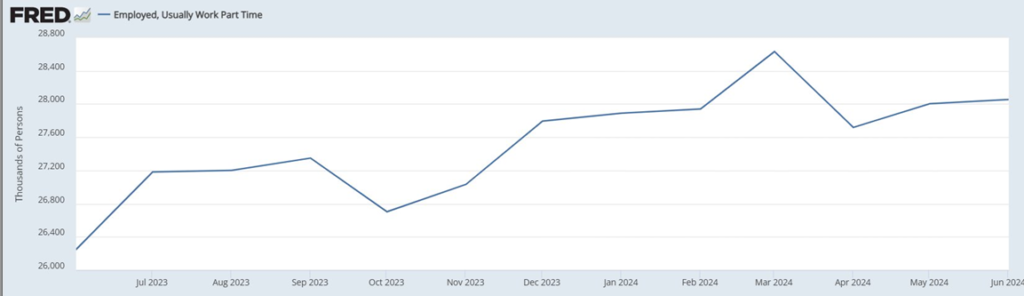
Part-Time Jobs and Seasonal Adjustments
This discrepancy raises an important question: where is the job growth reflected in the Non-Farm Payroll (NFP) numbers coming from? The answer lies in the increase of part-time jobs and the impact of seasonal adjustments, such as the Birth-Death Model. Over the past year, the U.S. has added 1.806 million part-time jobs. Given the loss of 1.5 million full-time jobs and the gain of 1.8 million part-time jobs, this results in a net increase of just 300,000 jobs. So, where did the remaining 1.3 million jobs reported in the NFP come from? It is likely that these figures are inflated due to seasonal adjustments made by the Bureau of Labor Statistics.
This leads us to hypothesize that job numbers may be significantly overstated, particularly in the context of an election year. The implications of such adjustments can be far-reaching, potentially masking underlying weaknesses in the labor market and presenting an overly optimistic picture of economic health. Understanding these nuances is crucial for accurately assessing the true state of the economy and making informed investment decisions.
| 1.6 million | 1.5 million | 1.8 million |
| Total Jobs added* | Full time jobs lost* | Part-time jobs added* |
Consumer Spending and Retail Sales
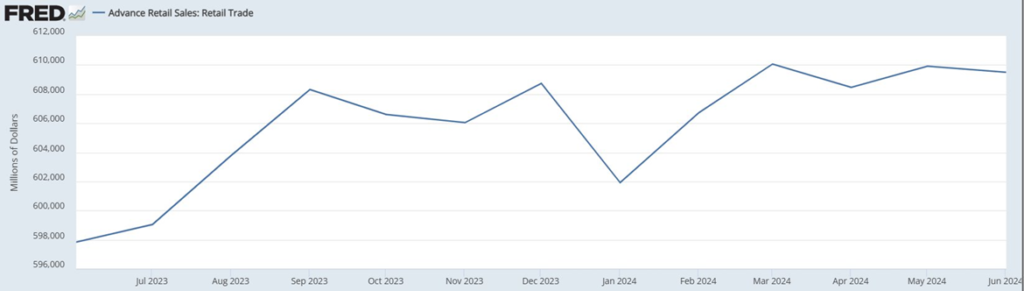
In conclusion, the labor market is softening, but this does not necessarily indicate that the U.S. consumer is in trouble just yet. Retail sales have been up this year, which is generally a good sign of economic health. Over the past year, advance retail sales have increased by around 2%. However, the question arises: are consumers buying more goods, or have the prices of goods increased? Based on inflation data from the past few years, it is evident that the price of goods has risen. The official inflation rate is approximately 20% over the past few years, with unofficial estimates likely higher. Given that Americans have been losing full-time jobs, it is safe to assume that labor does not have significant negotiating power for salary increases during this inflationary period. This brings us to a critical point: is this sales growth sustainable?
| 2% | 20% |
| Increase in advance retail sales | Official inflation rate on retail sales |
Sustainability of Sales Growth
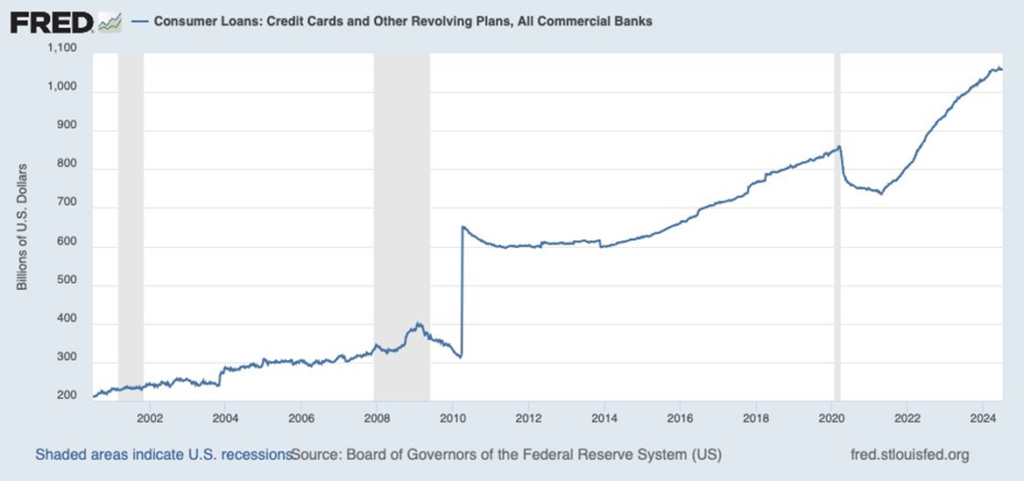
To address the sustainability of sales growth, we must consider whether a person’s expenditures are covered by their salary. If expenditures are within the limits of their salary, the consumption is sustainable. If not, where do they turn? Most Americans rely on credit cards for groceries, travel, and entertainment. If salaries had been outpacing inflation, credit card debt would likely be down or stable. However, as shown below, consumer loans have been growing rapidly since 2022. Consumer debt, often with interest rates between 20% and 30%, is expensive and difficult to pay off. This data suggests that the current spending patterns are likely unsustainable in the long term, but it may not yet indicate immediate trouble for the consumer.
Major Expenditures of American Consumers
Americans tend to have three main expenditures in their lives: home, credit card, and automobile. We have already examined credit card debt, which has been trending upward since 2022. Next, let’s analyze automobile expenditures. Americans commonly take out auto loans to buy new cars, borrowing against a depreciating asset at higher interest rates, which may not be the most financially prudent decision.
Real-Life Data: Automobile Loans
While government data provides a broad overview, delving into real-life data sets offers more nuanced insights. A valuable source of such information is Asset-Backed Securities (ABS) structures, which are pools of loans, debt, mortgages, etc. Investors buy the prepackaged debt and earn a return as long as the default rates are not too high. Focusing on lower-end consumers, who constitute the majority of the population, provides a more comprehensive picture of financial health.
One specific example is Carvana’s ABS structure, known as BridgeCrest. This 2023 vintage data shows that, as of July 18th, the 60-day delinquency rate is 8.38%, with a significant number of 30-day delinquent loans indicating a likely increase. This suggests that many consumers are accumulating credit card debt and are delinquent on car payments, which is concerning for the middle and lower classes.
Home Loan Delinquencies
Finally, let’s examine how consumers are managing payments on their homes. Reviewing May 2024 data for the Federal Housing Administration
(FHA) loans, which are primarily given to first-time homebuyers with subprime credit scores, reveals that approximately 10% of these loans are delinquent. This data suggests that the financial stability of consumers is not as strong as many mid-year market outlooks or economists have suggested.
Evaluating Consumer Financial Health
After reviewing various data points, it becomes evident that while headline economic indicators may appear positive, the underlying financial health of many American consumers is fragile. The rise in credit card debt, delinquencies in auto loans, and significant delinquencies in home loans all point to potential financial stress, particularly among middle and lower-income households. This analysis highlights the need for a more cautious and nuanced view of the current economic landscape in our mid-year market outlook.
Rate Cut Expectations
Market participants have been eagerly anticipating a decline in inflation to trigger the Federal Reserve’s rate-cutting cycle, with high expectations that this will further propel risk assets into higher valuations. The positive aspect is that rate cuts by the Federal Reserve are expected to begin in September. However, the historical context presents a more cautionary tale. Historically, when the Federal Reserve cuts rates to uninvert the yield curve, risk assets tend to perform poorly.
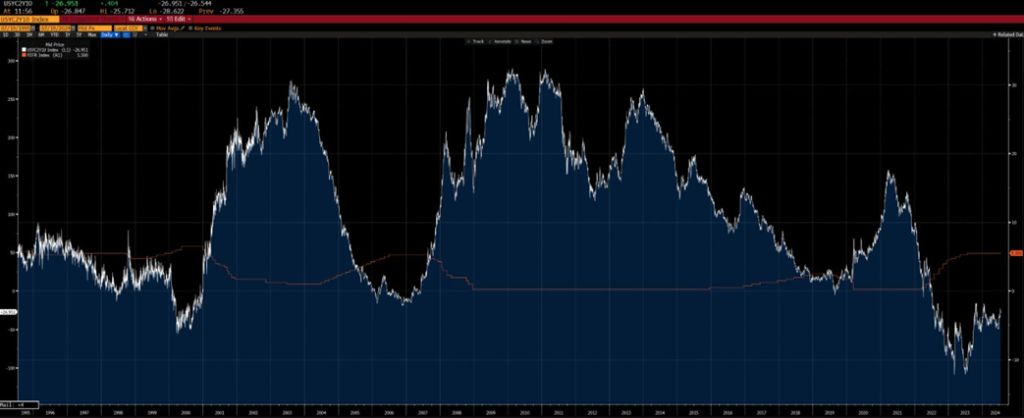
As illustrated in the two charts below, the last instances of the Fed cutting rates during a yield curve inversion occurred in 2000, 2007, 2020, and soon, today. In the first chart the Fed Fund rates (orange line) are displayed, showing that the Federal Reserve cut rates drastically during those years, which coincided with major economic recessions.
Federal Reserve rate cuts
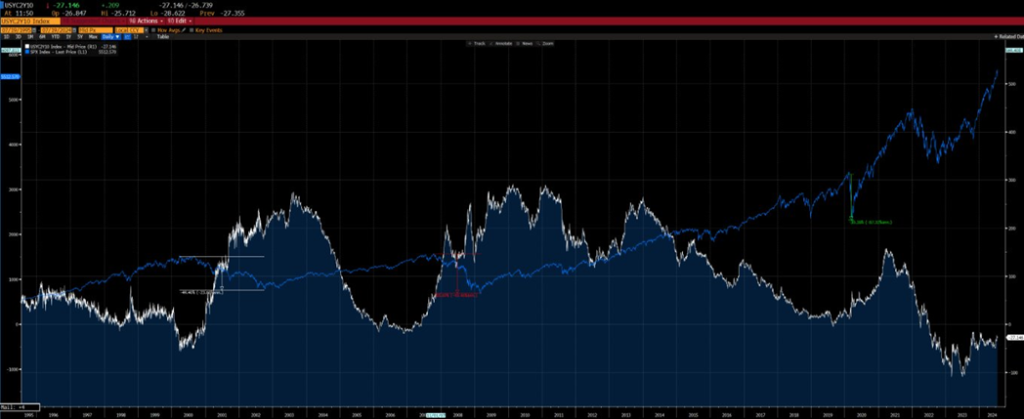
The second chart overlays the S&P 500 Index (light blue line) with the Yield Curve Inversion (2-Year Yield – 10-Year Yield) (white line). You can see that the curve is as inverted as it was during the years 2000 and 2008, which were periods leading up to significant market downturns.
Sahm Rule
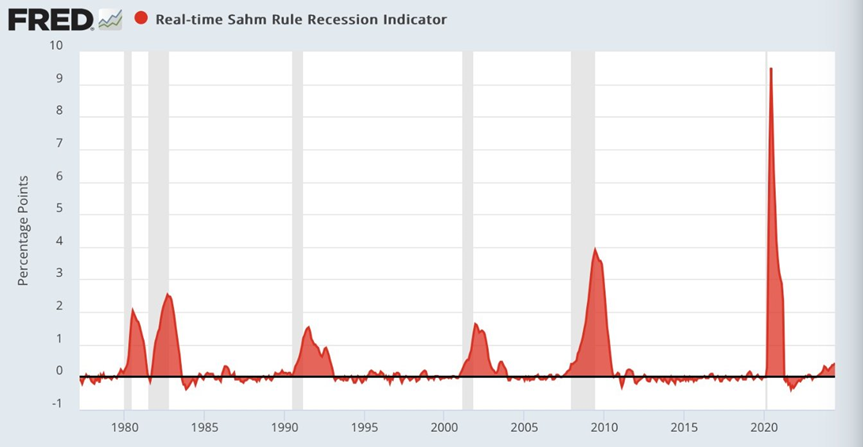
The Sahm Rule, developed by economist Claudia Sahm, is a reliable indicator for signaling the onset of a recession. According to the rule, the early stages of a recession are indicated when the three-month average unemployment rate rises above the lowest three-month unemployment rate over the past 12 months by half a percentage point or more. This rule is celebrated for its simplicity and efficiency in identifying recessions.
The chart below illustrates this concept, with the gray shaded areas marking periods when the United States entered into a recession. Currently, as seen at the end of the graph, the unemployment rate is nearing the 0.5% threshold, suggesting that we may be approaching the early stages of a recession. This indicator provides a clear and timely warning, helping to contextualize current labor market trends within historical patterns.
Equity Market Outlook
The equity market has become quite euphoric. Over the past few years, the preferred investment vehicles have been Exchange Traded Funds (ETFs) that mirror the returns of major indices. The most popular ETFs have tracked the S&P 500 and the Nasdaq 100. This phenomenon of passive investing has led to a strategy of buying indices at any price, without regard to the valuation of the underlying assets.
Composition of Major Indices
To understand the implications of this investment strategy, let’s examine the composition of the Nasdaq 100 and the S&P 500. Both of these indices are market capitalization-weighted, meaning that a significant portion of investment is concentrated in the top 10 companies. For every dollar invested in these indices, $0.36 (S&P 500) and $0.54 (Nasdaq 100) are allocated to the top 10 names. This concentration risk is a critical factor for investors to consider.
Passive investing has been highly popular over the past decade, with the S&P 500 outperforming the majority of active managers. However, when holding a passive investment, it is essential to question what you own and at what price. The market action since 2020 has been remarkable, with the market rising steadily despite various economic and geopolitical challenges.
Market Resilience and Valuation Concerns
The market’s resilience has been tested by numerous events: inflation, higher interest rates, the war in Ukraine, regional banking crises, conflicts such as Israel-Palestine, and even political instability, including an assassination attempt on a former president and uncertainty about who will be one party’s nominee. Despite these significant events, the S&P 500 has maintained an aura of invincibility, with market participants seemingly ignoring potential risks.
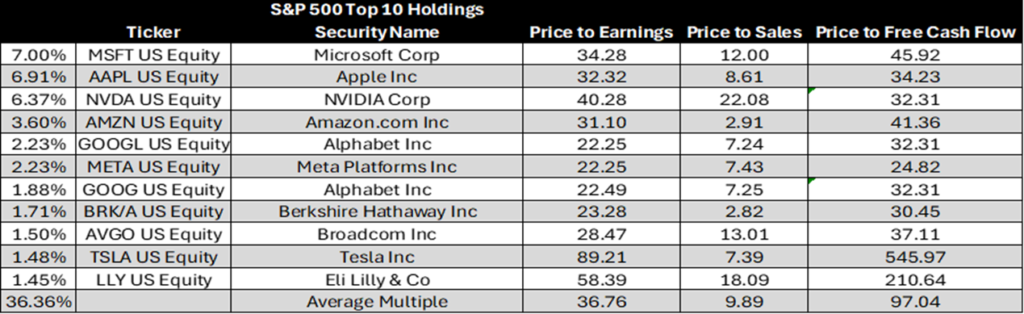
This invincibility raises concerns about market valuations. On the next chart, we present the valuation of the top ten holdings. The lack of risk pricing in the current market environment suggests that investors may be overly optimistic, potentially overlooking the inherent risks associated with high valuations. This is evident from the extremely high price-to-earnings, price-to-sales, and price-to-free-cash-flow ratios that have become the norm, as shown in the chart. Such elevated valuations indicate that the market is not adequately pricing in potential risks, which could lead to significant adjustments if underlying economic conditions change.
Historical Context and Valuation Concerns
Part of our job as financial analysts is to act as historians, using past market events to help predict future market trends. By studying historical patterns and valuations, we can gain insights into where the market might be heading. Currently, we see a number of stocks trading at valuations greater than 10x price-to-sales. This raises significant concerns, as similar patterns in the past have often preceded market corrections.
To illustrate, during the Dot-Com bubble, many companies experienced extraordinary stock price increases despite their stretched valuations. One notable example is Sun Microsystems, whose stock soared from $5 to $64 before eventually plummeting back to $5. This historical episode serves as a cautionary tale, highlighting the risks of investing in companies with excessively high valuations.
Fortunately, I found a quote from after the Dot-Com bubble that encapsulates what tends to happen when you buy companies at such stretched valuations. Sun Microsystems during the Dot-Com bubble had an impressive run from $5 to $64, only to ultimately fall back to $5.
“At 10 times revenues, to give you a 10-year payback, I have to pay you 100% of revenues for 10 straight years in dividends. That assumes I can get that by my shareholders. That assumes I have zero cost of goods sold, which is very hard for a computer company. That assumes zero expenses, which is really hard with 39,000 employees. That assumes I pay no taxes, which is very hard. And that assumes you pay no taxes on your dividends, which is kind of illegal. And that assumes with zero R&D for the next 10 years, I can maintain the current revenue run rate. Now, having done that, would any of you like to buy my stock at $64? Do you realize how ridiculous those basic assumptions are? You don’t need any transparency. You don’t need any footnotes. What were you thinking?” –
Scott McNealy, CEO of Sun MicroSystems
Fixed Income Market Outlook
Our Fixed Income mid-year market outlook thesis is straightforward: prioritize higher-quality fixed income over high yield. We strongly recommend U.S. Government Securities and Investment Grade Corporate Credit as the core of fixed income portfolios.
Preferred Instruments and Yield Curve Insights
We believe that the 2-Year Treasury currently represents the most attractive spot on the yield curve. With ongoing economic uncertainties, the 10-Year and 30-Year Treasuries are likely to rally due to a flight to safety, providing stability in volatile markets. Conversely, we are cautious about Private Credit, Mortgage-Backed Securities (MBS), High Yield bonds, and Leveraged Loans, as these sectors may face increased risks in the current economic environment.
Shift in Coupon Preferences
Our preference for fixed income coupons has shifted from Floating Rate to Fixed Rate Coupons. Given the potential for economic downturns and the likelihood of rate cuts, Fixed Rate Coupons offer greater predictability and security, making them a more attractive option in uncertain times.
Federal Reserve Outlook
The Federal Reserve is anticipated to cut rates for the first time in September. If the economy deteriorates as expected, we foresee the Federal Reserve initiating a series of aggressive rate cuts, potentially bringing the Secured Overnight Financing Rate (SOFR) back to around 2.5%. This proactive approach aims to mitigate economic slowdown and support market stability.
Conclusion
The 2024 mid-year market outlook presents a landscape of high expectations tempered by significant risks. While the equity market has seen impressive gains, largely driven by a few key stocks, the broader economic picture reveals potential challenges ahead. Despite robust headline job growth and a “goldilocks” environment for risk assets, deeper analysis indicates vulnerabilities, particularly with the loss of full-time jobs and the reliance on part-time employment and seasonal adjustments.
Consumer spending has shown resilience, but this may be unsustainable given rising debt levels and the lack of substantial wage growth relative to inflation. The current spending patterns, supported by credit rather than income, suggest financial stress among middle and lower-income households.
In the equity market, the popularity of passive investing has led to high valuations that may not accurately reflect underlying risks. Historical parallels, such as the Dot-Com bubble, highlight the dangers of investing in companies with stretched valuations, which could lead to significant market corrections.
The fixed income outlook emphasizes the importance of higher-quality assets over high yield. U.S. Government Securities and Investment Grade Corporate Credit are recommended as core portfolio components, with a preference for fixed rate over floating rate coupons due to anticipated economic downturns and potential rate cuts by the Federal Reserve.
Navigating 2024
As we move through the remainder of 2024, it is essential to remain vigilant and adaptable, balancing optimism with caution. By understanding historical patterns and current economic indicators, investors can better navigate the complexities of today’s market environment and identify profitable opportunities even amidst instability.
Align your portfolio with confidence using Tiempo Capital’s tax efficient investing and tailored risk management strategies. As a leading South Florida family office, we help clients navigate volatility through our expert Investment Management team. Schedule a consultation today — and explore how our expertise can guide you through market volatility.
If you’re looking for more insights, you can explore our full library of articles. Click here for content related to equities or here for in-depth guidance on investments.
Download the full report here:
This material is for informational purposes only and does not constitute financial, legal, tax, or investment advice. All opinions, analyses, or strategies discussed are general in nature and may not be appropriate for all individuals or situations. Readers are encouraged to consult their own advisors regarding their specific circumstances. Investments involve risk, including the potential loss of principal, and past performance is not indicative of future results.